Despite the fact that Google Chrome takes a lot of memory to run, it provides a lot of features for both users and developers. And one such thing is the Chrome Developer Tools. It provides a ton of options that makes the life of web developers easier. It also helps in debugging web applications using various methods.
In this article, we will be discussing some of the dev tools features that I think every developer should know which will help them in creating error-free and high performing web applications.
Note: The following options are provided by the Chrome Developer Tools and so to use it, you should always keep it open. The shortcut key to open it is F12 for Windows and fn+F12for Mac.
Viewing unused CSS and JS
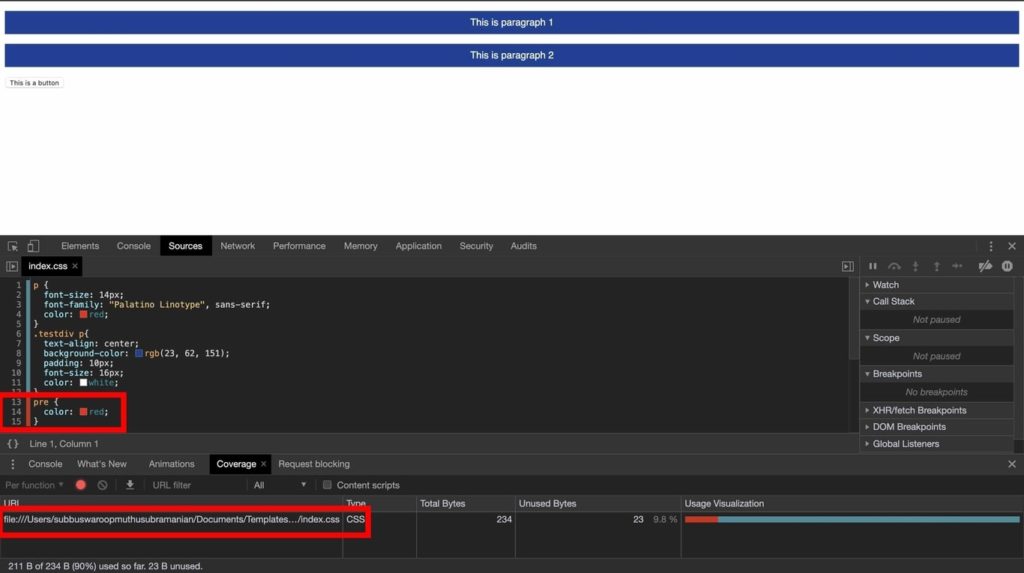
When developing a web application, especially if you are at the beginner level, it’s easy to write a lot of code that doesn’t actually have any effect on the web page. Rather than going through the entire code to find the unused CSS and JS, chrome developer tools provide an easier way.
- Press
Command+Shift+P(Mac) orControl+Shift+P(Windows) while the dev tool is in focus to open the command menu. - Type coverage and select Show Coverage.
- Click on Show Instrumenting Coverage And Reload Page (insert icon). The page reloads and shows how much of CSS and JS is being used from each file. Green means used. Red means that they are unused.
- Click on a file to see a line-by-line breakdown.
Console Utilities API
When it comes to the chrome dev tools, the most often used feature would be the Console API. We generally use console.log()in our code to print what we need but it’s fine for smaller applications. For larger applications, it’s better to use the default functions in dev tools which make debugging easier. Here are some of them:
$_
Returns the value of the most recently used expression in the console.

$(selector, [startnode]), $$(selector, [startnode])
The former returns a reference to the first matching DOM element with the specified selector name and the latter returns an array of all the matching elements with the selector. They also support an optional second parameter that specifies from which Node or element it should start its search.

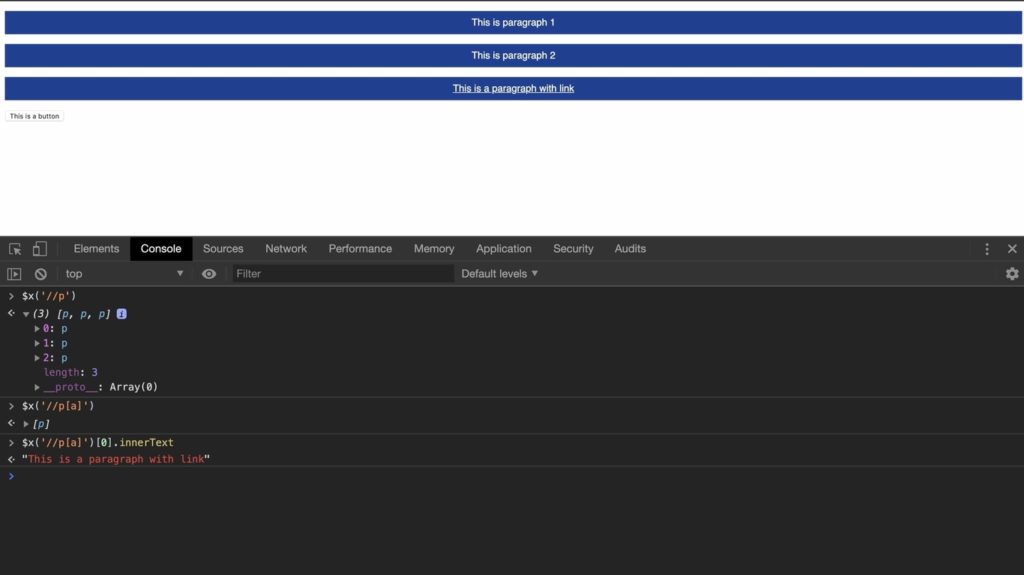
$x(path, [startNode] )
Returns an array of DOM elements that match the given XPath expression. It also has an optional startNode parameter. The expression should always start with a “//”.
debug( function )
This is useful when you want to add a debug point to a function at run time. The debugger stops at the point when the function is called. Similarly, you can use undebug(function) to remove the debug point.
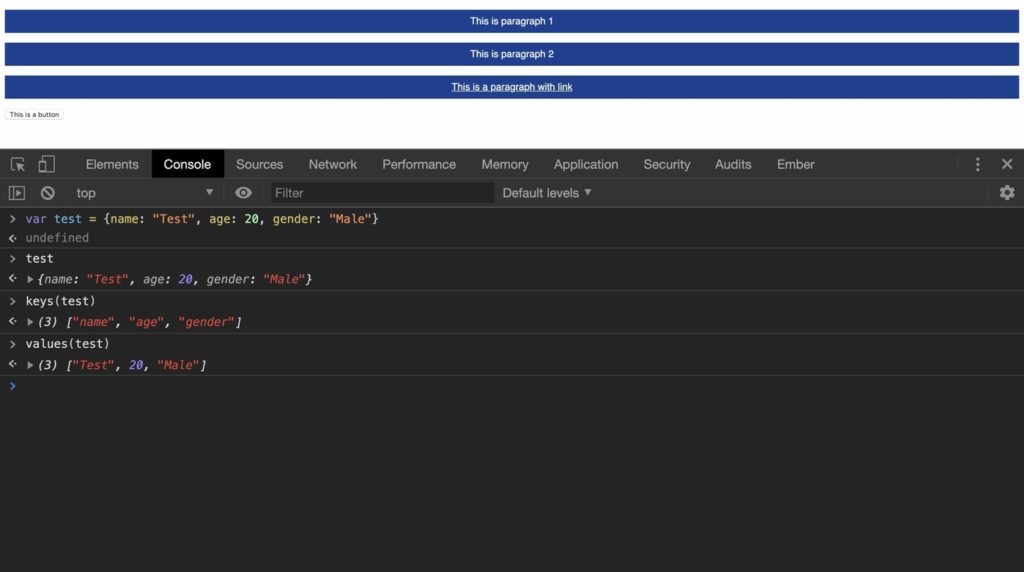
keys and values
keys() return an array containing the names of the properties in an object whereas values() return their corresponding values.
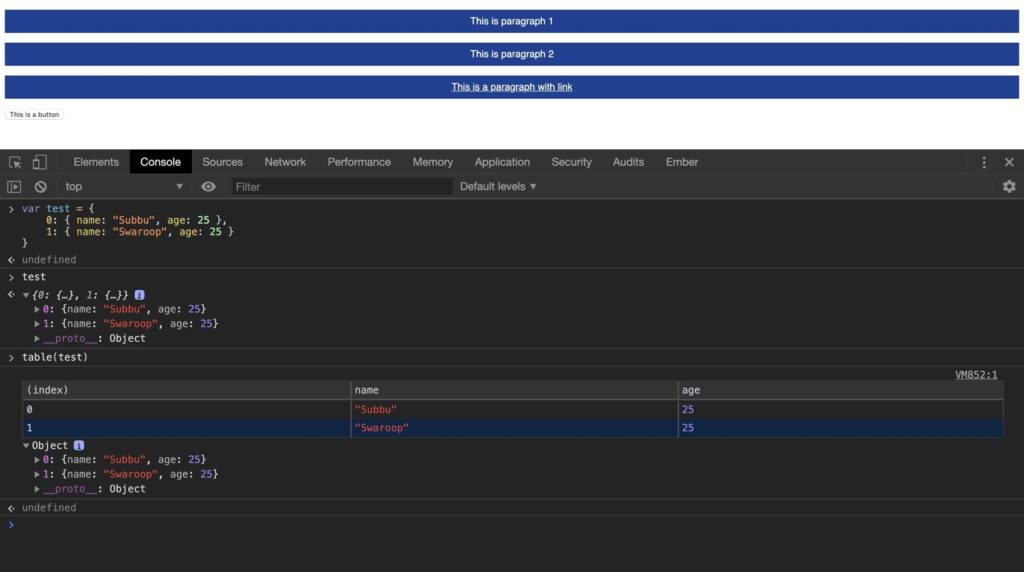
table( data, [columns] )
If you are bored with the console displaying object data, you can use this function to display it in a table format.
Live Expressions
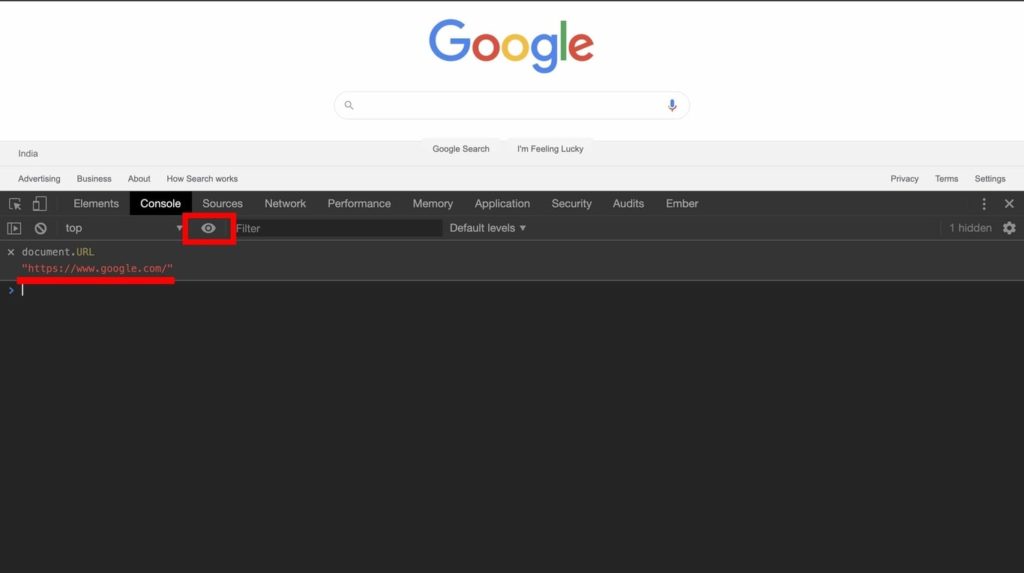
Do you feel like you are typing the same expression in your console every time to check if the value has changed? Then you can use Live Expressions. It evaluates automatically and returns real-time values. For eg:
Click on the eye icon which opens up live expressions. Type document.URL and click Control+Enter (Windows) or Command+Enter (Mac) to save it. Go to the search bar and go to any website you want. The live expression will return the current URL automatically.
Simulating slower network connections
The 4G technology that we use right now (at the time of writing this article) have data transfer rates much faster than the previous 3G technology. We will soon implement 5G as well and it will be even faster than 4G which makes websites load even faster.
But is 4G available everywhere? What about the rural areas which still have 2G or 3G? A good web developer should always consider various network speeds when developing a web application and to test that, we can use chrome dev tools.
- Open dev tools and go to the Network tab. Look for the dropdown that says Online by default.
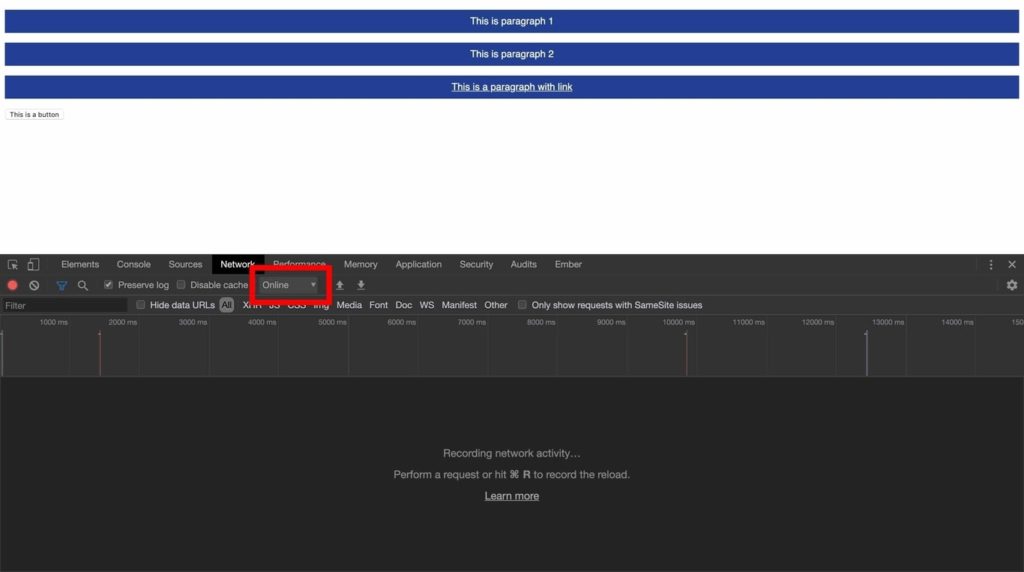
- Click on it and select Slow 3G.
- Long press the page reload button and select Empty Cache and Hard Reload. This will clear your browser cache and requests new resources from the server.

Note: Also, note that Empty Cache and Hard Reload will be available only when the dev tool is open.
The Audits tab
Lighthouse is an open-source tool created by Google Chrome for testing the quality of web pages. You can run it against any web page and it gives you details about the page’s performance.
If you are new to dev tools, then there’s a greater chance that you might have missed the Audits tab. And since Lighthouse is integrated into the audits tab, this makes it easy to test our website performance. Here I have tested my blog site’s performance.
- Go to dev tools and click on the Audits tab. If you can’t find it, then click on the double arrow mark and you can see it listed in the dropdown.
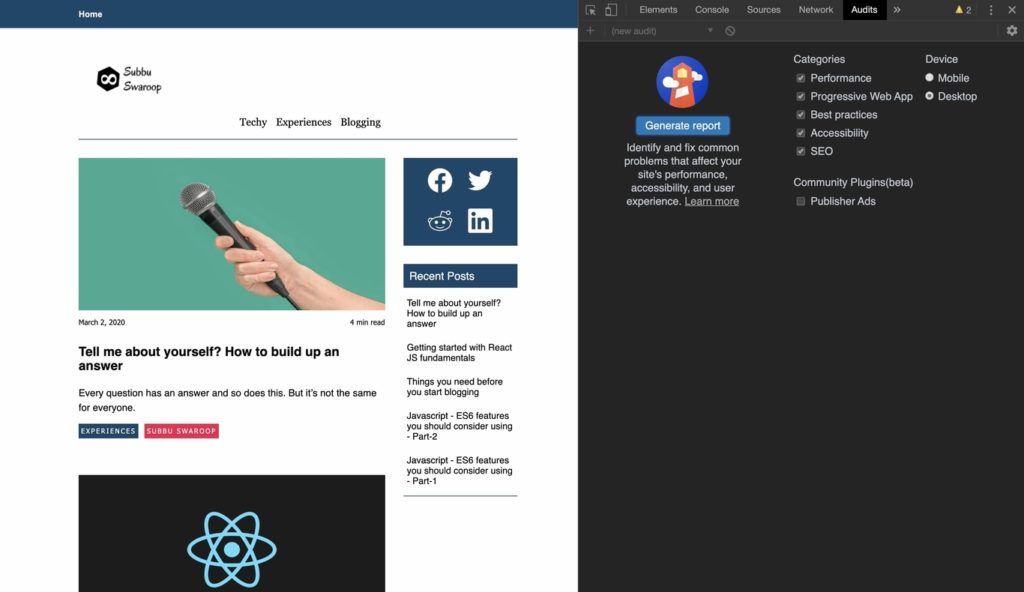
- You can choose how your websites should be tested by selecting the appropriate categories and can also choose the device to test it against either Mobile or Desktop. Then click on the Generate report.
- You will get a report similar to this:
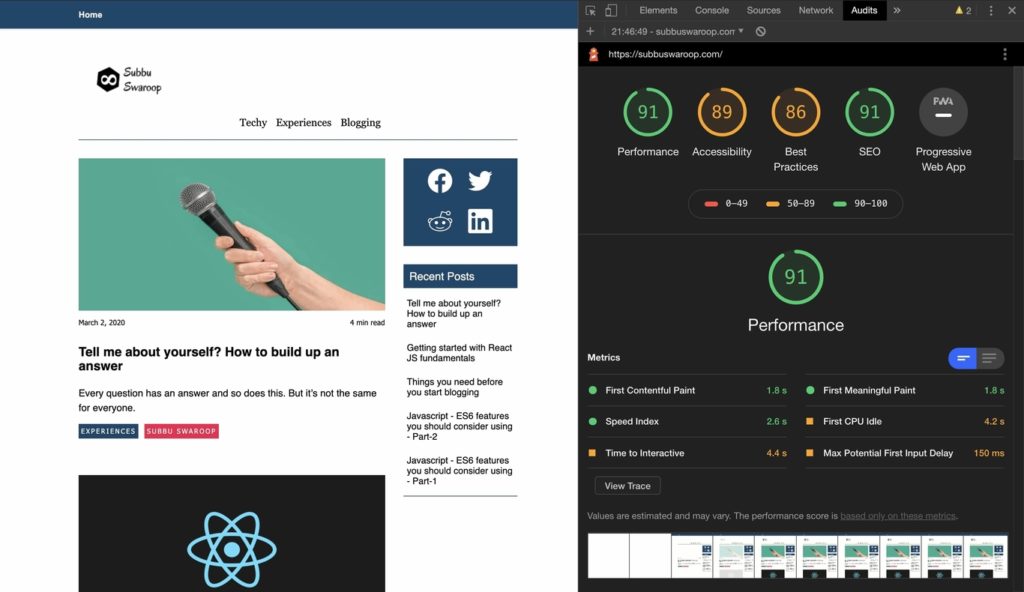
Go through the report and find out what makes your website slower and how to improve on them. Once making those changes, run a new audit and compare it with the old one to get a better understanding.
Conclusion
We have covered only the basic features that the dev tools provide. It also provides some advanced features which I’ll be covering in the next article in detail.
I hope this article has helped you get some ideas about the dev tools. Start using it in your projects frequently so that you will get a hang of it.
Please feel free to comment if you liked the post or if you think it can be improved in any way.
Signing off for now.
Arigato Gozaimasu 🙂